
AI Job Displacement - April 2026
The March report looked strong. What it measured didn't.

This project began with curiosity.
I didn’t set out to predict massive layoffs. I didn’t set out to predict anything.
What I wanted to do was establish a way to pierce the fog of opinion and fear and get a better read on what would likely happen, and when. That led me to create and train two thoughtmodels that could find signal in the noise, back it up with data, and test against the knowledge and wisdom of generations of accumulated insight.
I began with a projection last summer that aimed to be roughly right rather than precisely wrong. It found a years-wide gap in consensus thinking and likely outcomes. Six months later, the conditions it predicted were happening 2-3 years earlier than the consensus.
Today’s analysis is the most information-rich and data-heavy yet. I’m not offering it to stoke fear—much the opposite. I’m showing the direction under the numbers because I believe business and work are changing in profound ways, and I want to share what I’ve learned. What follows is grim news for those who like predictable quarters and full-time W2 employment. But I don’t see it as grim news at all.
I’m robustly optimistic about the direction business and work are headed. Still, transitions can be hard. This one will bring some pain. But it’s creating the conditions for what’s next. I believe we have a unique opportunity if we can keep clear eyes, heads, and hearts.

On April 10, the University of Michigan published its preliminary consumer sentiment reading for April 2026. It came in at 47.6: the lowest number in the 74-year history of the survey. Lower than June 2022. Lower than the worst month of the financial crisis. Lower than any point during COVID.
Six days earlier, the Bureau of Labor Statistics reported that the U.S. economy added 178,000 jobs in March. Markets rallied. The word “resilience” appeared in every headline. FinancialContent ran a piece titled “Labor Market Resilience: March Jobs Report Shatters Forecasts.” Consensus had been 59,000 to 65,000. We nearly tripled it.
So which is it? A resilient labor market or an all-time low in how people feel about the economy?
Both, actually. And the distance between them is the story.
I spend most of my working hours inside economic data, building projection models, tracking the structural layer underneath the headlines. It’s the kind of work that makes you unpopular at dinner parties. But four installments into this series, I keep finding the same thing: the number and the thing the number is supposed to measure are drifting apart. This month, the gap is the widest I’ve seen.
Is unemployment a useful measure…?
The number says one thing. The structure underneath says another.
+178,000 nonfarm payrolls, seasonally adjusted. Total private sector: +186,000. Government: -8,000. Unemployment rate: 4.3%, down a tick from February’s 4.4%.
Good print. Until you pull on the threads.
Thread one: the strike. Roughly 35,000 of the 178,000 were physician office workers returning from a strike. These weren’t new jobs. They were the same jobs, temporarily absent from the count in February, returned in March. Strip them out and organic job creation was approximately 143,000. Still decent. Not the headline.
Thread two: the revision. The same release revised February from -92,000 to -133,000. That makes February the second-worst payroll month since the pandemic. The combined January-February revision was a net -7,000. The two-month picture got slightly worse, not better.
Thread three: the three-month average. January: +160,000 (revised up). February: -133,000 (revised down). March: +178,000. Average those and you get roughly 68,000 jobs per month. That is not a healthy labor market. That is a labor market running below population growth.
Thread four: who left. The civilian labor force shrank by 396,000 people in a single month, from 170,483,000 to 170,087,000. Labor force participation fell to 61.9%. People classified as “not in the labor force” increased by 488,000. Discouraged workers, those who stopped looking because they believe no jobs exist for them, spiked 39% in one month, from 366,000 to 510,000. Marginally attached workers rose by 325,000 to 1.944 million.
The unemployment rate fell partly because the denominator shrank. People didn’t find jobs. They stopped being counted.
Thread five: the other survey. ADP’s National Employment Report showed +62,000 private-sector jobs in March. That’s a 116,000 gap from the BLS private-sector figure of +186,000. ADP and BLS diverge regularly, but this is a wide spread. ADP’s size breakdown tells its own story: small businesses (1-49 employees) added +85,000 jobs. Medium firms (50-499) shed -20,000. Large firms (500+) shed -4,000. The entire positive print rested on the smallest employers.
Thread six: the frozen labor market underneath. The February JOLTS report, released March 31, showed a hires rate of 3.1%, matching the COVID-era low and the lowest since January 2011. Job openings fell to 6.882 million. The quits rate has been locked at 1.9% for eight consecutive months, a decade-low signal that workers feel trapped, unable to risk a job change. Long-term unemployment (27+ weeks) sits at 1.8 million, representing 25.4% of all unemployed and up 322,000 year-over-year. Average unemployment duration: 25.3 weeks, up from 21.4 a year ago. U-6 underemployment: 8.0%.
This is not a resilient labor market. It’s a labor market that generates a resilient headline.
Change is here, but it’s not evenly distributed
The March gains were concentrated. Healthcare and social assistance: +89,900, but remember, 35,000 of that was the strike reversal. Leisure and hospitality: +44,000, driven by seasonal food services and entertainment hiring. Construction: +26,000. Transportation and warehousing: +21,000, almost entirely couriers and messengers at +20,400.
Now look at what’s bleeding.
Financial activities: -15,000. Finance and insurance specifically: -16,200. This sector has now shed 77,000 jobs since its May 2025 peak. Credit intermediation: -8,500. Insurance carriers: -5,700. Month after month, the cuts deepen.
Professional, scientific, and technical services: -13,500. Computer systems design: -13,200. The broader professional and business services category showed +2,000, essentially flat, only because administrative and support services (+18,500) masked the professional-services decline.
Information: -3,000. This sector has been declining for months. Computing infrastructure, data processing, telecommunications: all contracting.
Federal government: -18,000. Federal employment is now 355,000 below its October 2024 peak, a decline of 11.8%. This is an unprecedented peacetime reduction in the federal workforce.
The pattern is worth stating plainly. The sectors most exposed to AI, finance, professional services, information technology, computer systems design, are the ones bleeding consistently. The sectors holding the headline up, healthcare (with a strike bounce), leisure and hospitality (seasonal), construction (physical labor), are the ones least exposed to the current wave of AI displacement.
The headline aggregates them. The structure separates them.
Wall Street rewards layoffs
Something shifted in March. For the first time since Challenger, Gray & Christmas began tracking the metric in 2023, AI was the number-one cited reason for layoffs in a single month. Of the 60,620 job cuts announced in March, 15,341, or 25%, were attributed to AI. For Q1 2026, tech-sector cuts totaled 52,050, up 40% year-over-year. According to Nikkei Asia data, 78,557 tech workers were cut globally in Q1, with 47.9% of those cuts explicitly attributed to AI and workflow automation.
The individual announcements tell the story at company scale:
Oracle: An estimated 30,000 cuts, roughly 18% of its workforce, explicitly tied to AI infrastructure spending. Stock down 27% year-to-date. But it spiked nearly 6% the day of the announcement and continues to climb.
Atlassian: 1,600 cuts, 10% of the company. CEO Mike Cannon-Brookes: “It would be disingenuous to pretend AI doesn’t change the mix of skills we need.” Severance cost: $225-236 million. Stock rose 2% on the announcement.
Block: 4,000 cuts, taking the workforce from roughly 10,000 to under 6,000. CEO Jack Dorsey: “Intelligence tools have changed what it means to build and run a company.” Then, the line that will echo: “Most companies will reach the same conclusion within 12 months.” Stock rose 24%.
Citigroup: Targeting approximately 20,000 reductions, about 13% of workforce. CFO Mark Mason cited AI-enabled systems for middle-office functions.
Salesforce: CEO Marc Benioff, on AI agents now handling roughly 50% of customer interactions: “I need less heads.”
Read those stock reactions again. Oracle cuts 18% and the stock spikes. Atlassian cuts 10% and goes up. Block cuts 40% and goes up 24%. The market is not treating these as distress signals. It is rewarding them. The numbers are lying to you, but not on purpose. That’s almost worse.
This is the profit-per-employee thesis becoming operational. Block’s COO Amrita Ahuja has been tracking gross profit per employee as the company’s core efficiency metric: $500,000 in 2019, $750,000 in 2024, $1 million in 2025, targeting roughly $2 million in 2026. Their internal AI agent “Goose” has been in production for 18 months. Developer productivity is up 40% per engineer since September 2025.
The AI-native companies have already arrived at the destination. Midjourney generates approximately $18 million in revenue per employee with a team of roughly 11 people. Cursor hit $1 billion ARR with around 300 employees, $3.3 million per head. The old SaaS benchmark of $200,000 ARR per employee is now baseline; “good” starts at $300,000; “great” at $500,000-$700,000. Gartner forecasts that new unicorns by 2030 will target $2 million ARR per employee.
Most CEOs see these numbers. They’ll pursue this ratio.
The KPMG Q1 2026 AI Pulse survey found 54% of organizations are now actively deploying AI agents, up from 12% in early 2024. The Federal Reserve’s April 3 FEDS Note estimates that 78% of the American workforce now works at a firm that has adopted AI. McKinsey is running 25,000 AI agents alongside 40,000 human employees. CEO Bob Sternfels says every human employee will be “enabled by at least one agent” by year-end 2026.
The infrastructure is not a speculation. It is an expenditure. Hyperscaler capital expenditure for 2026 is projected at $660-690 billion, nearly double 2025 levels. Amazon alone is spending $200 billion. That money is being spent to build the capacity that replaces tasks currently done by humans. That’s what capital allocation has looked like for a couple of years now.
Layoffs, regret, rehiring, and…?
If you’ve been following this series, you know I refuse to flatten complexity. The regret-rehire cycle is real, and ignoring it would make the analysis dishonest.
The pattern looks like this: companies announce AI-driven layoffs. Then they discover the AI doesn’t fully work, or that they need more human oversight than expected, or that customer satisfaction drops. Then they rehire, partially.
The data is substantial:
Forrester’s 2026 predictions report: 55% of employers who made AI-attributed layoffs already regret the decision. More than one in three spent more on restaffing than they saved from the cuts.
Careerminds survey of 600 HR professionals: 35.6% rehired more than half the roles they cut. “More than half of HR leaders said AI required more human insight than anticipated.”
Gartner predicts that by 2027, half of companies that attributed cuts to AI will reinstate employees for similar roles, often under different titles.
Harvard Business Review reported that 60% of global executives cut headcount in anticipation of AI. Only 2% because AI was actually performing in production.
Klarna is the canonical case. Workforce from 7,000 (2022) to 3,400 (2024), driven by a chatbot that claimed to do the work of 700 agents. Then repeat contacts jumped 25%. CEO Sebastian Siemiatkowski admitted: “We went too far.” They rehired. And now? Siemiatkowski expects headcount to fall further to roughly 2,000 by 2030, not through another round of layoffs, but through natural attrition at 20% annual turnover.
People watching this cycle and concluding “see, they need humans after all” are reading a correction as a reversal. It is not a reversal.
This is a damped oscillation within a reinforcing loop. Each cycle, cut, regret, partial rehire, learn, cut again with more precision, settles at a lower equilibrium of human headcount. Klarna’s trajectory is not 7,000 → 3,400 → 7,000. It is 7,000 → 3,400 → partial rehire → 2,000 target. The oscillation dampens toward displacement, not recovery. The companies in their second or third cycle are not making the same mistakes. They’re cutting with better information about which tasks the AI can actually do.
The 2% figure from HBR, only 2% of cuts driven by AI that was actually working, is itself a time-stamped number. It was true when measured. It is less true each quarter as the tools improve. The gap between “cut in anticipation” and “cut because it’s working” is closing from both directions: models improve, and organizations learn what to automate.
The evaporation thesis
Everything I’ve described so far is top-down. Companies announce layoffs. The numbers show up in Challenger data. This is the visible displacement.
There is a second dynamic running simultaneously. I explored it in depth in The Evaporation Thesis, and it still doesn’t appear in any government report.
Bottom-up displacement is when workers automate their own workflows, but not because they’re told to. More because the tools are available, cheap, and obviously useful. The Fed’s FEDS Note found that 41% of the labor force now uses generative AI at work, up 31% year-over-year. The KPMG survey shows 63% of organizations now require human validation of AI agent outputs, up from 22% just a year ago. Think about what that means: agents are increasingly doing primary work and humans are reviewing it, not the other way around.
If that math ain’t mathing, try it this way: GPT-4-level intelligence cost $30 per million tokens in 2023. It costs roughly $0.06 per million tokens today—a 500x collapse in 16 months. That’s more than a price drop. It’s is a phase change in the economics of cognition. At these prices, the math on automating a $60,000/year knowledge-worker task is trivially positive. (I’m tracking these cost curves monthly now; subscribe if you want first looks at where they’re heading.)
Meanwhile, business applications are running at roughly double pre-pandemic rates: 491,941 new business applications in March 2026 alone. What these formations represent is another compelling thread to pull. Many are likely necessity entrepreneurship: displaced workers who can’t find a corporate role starting consulting practices, automation agencies, and AI-augmented solopreneurships. The gig economy has swelled to $674 billion globally with 70 million U.S. participants, projected to cross 50% of the workforce by 2027.
But AI is compressing freelance value too, and that picture’s more complicated than I realized last summer. Ramp’s research tracking actual firm-level spending found that freelance marketplace spend fell from 0.66% of total corporate spend in Q4 2021 to 0.14% by Q3 2025, while AI model provider spend rose from zero to nearly 3%. More than 50% of businesses using freelancers in 2022 have stopped entirely. For the highest-exposure firms, every $1 reduction in freelance spend corresponded to only $0.03 in AI spend, a 25x cost savings. Fiverr has lost 95% of its stock value since 2021. Upwork’s active buyers have fallen from 4.2 million to 3.1 million.
The evaporation layer doesn’t show up as layoffs. It shows up as hours that don’t get hired. Contracts that don’t get issued. Junior roles that don’t get posted. Resume.org surveyed roughly 1,000 U.S. business leaders and found that 36% expect to stop hiring entry-level workers by year-end 2026. Entry-level job postings for AI-exposed roles have already fallen more than 40% from 2023 levels according to Revelio Labs. Only 30% of 2026 college graduates are securing full-time jobs post-graduation, down from 41% in 2024.
This is not a tight labor market with a skills mismatch. It is a labor market where the work itself is changing shape faster than the instruments can track.
The Stanford Digital Economy Lab paper, updated through February 2026, found that employment for 22-25-year-old software developers has declined roughly 20% from the late 2022 peak. Call center hiring for the same age group is down about 15%. Their regression analysis shows the decline in AI-exposed occupations becoming statistically significant starting in 2024 and reaching approximately 16% by October 2025. It has not reversed.
Erik Brynjolfsson’s framing is useful here: the traditional career “pyramid,” many junior roles feeding into fewer senior ones, is shifting to a “diamond” shape. The entry points are shrinking while mid-level and senior roles remain stable or grow. The base of the workforce pipeline is narrowing. Nobody above it can feel it yet.
I’ve been working through a finding with the Hari framework that I want to address here: the apprenticeship crisis. The junior roles being eliminated aren’t just jobs. They’re the training pipeline for the next generation of senior professionals. When a law firm uses AI to replace research associates, or a consulting firm eliminates junior analysts, or a bank automates the entry-level credit analysis that teaches how to think about risk, they’re not just cutting a cost line. They’re severing the mechanism that produces the judgment, relationships, and domain expertise that make senior professionals valuable. The Dallas Fed’s experience premium research shows that AI complements experienced workers while substituting for entry-level ones. But the experienced workers who benefit today were built by the entry-level positions being destroyed. This is a 5-10 year delayed structural failure, invisible to current efficiency metrics, devastating to the professional pipeline underneath. Firms optimizing for quarterly margins are consuming seed corn.
This matters for the Hari projection because evaporation-layer displacement doesn’t trigger any of the traditional alarm systems. It doesn’t register as a layoff. It doesn’t create an unemployment claim. It doesn’t even create a discouraged worker, because the person never had the job in the first place. It is preemptive displacement, and it may be larger than top-down displacement by the time we have instruments to measure it.
The chain has almost fully activated
In August 2025, the first installment of this series proposed a six-link causal chain for AI-driven workforce displacement. In February, the six-month review showed the chain tracking ahead of schedule. In March, I showed the structural deterioration underneath a headline that looked stable.
Here is where each link stands in April 2026:
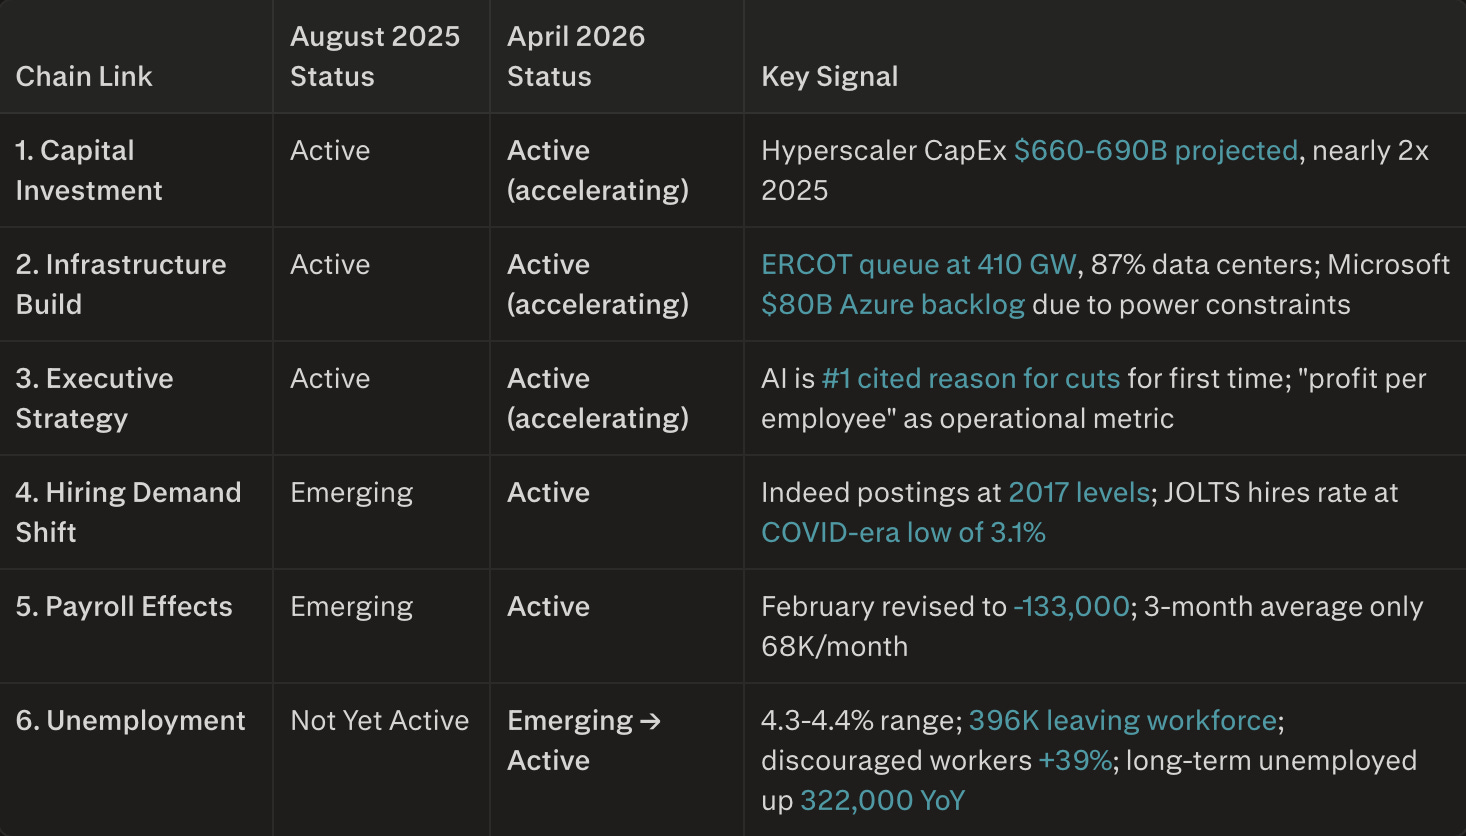
In August, I scored the composite signal at approximately 3.8. In February, at 4.57. This month, I’d place it in the 4.65-4.75 range. The incremental shift reflects the transition of Link 6 from Emerging toward Active: the unemployment picture is deteriorating underneath a headline rate that looks relatively benign.
All six links are now active or in active transition. This was the August projection’s end state for the onset of significant displacement. We projected that window as Q3 2026.
Q3 2026 is 10 weeks away.
Narrative lag
There’s a concept I’ve been developing across these installments: the narrative lag.
The headline was +178,000. The market rallied. The narrative was “resilient economy.” That narrative was set within 24 hours of the release and will persist until the next data point challenges it.
But:
University of Michigan consumer sentiment hit an all-time record low of 47.6 in April.
Year-ahead inflation expectations surged from 3.8% to 4.8%, the largest single-month jump since April 2025.
Goldman Sachs raised recession probability from 20% to 30% within two weeks in March. Moody’s Analytics places it at 48.6%. Polymarket prediction traders: 31%.
Total credit card debt hit $1.28 trillion, a record since the New York Fed began tracking.
National office vacancy sits at 18.4%. Industrial sublease space hit a record 278 million square feet, exceeding even the 2023 office sublease peak.
A NerdWallet survey found 65% of respondents expect a recession in the next 12 months.
The New York Fed describes the current moment as displaying “characteristics of a K-shaped economy”: a disconnect between stock market performance and consumer reality. Goldman’s AI economist Joseph Briggs said in March: “The big story in 2026 in labor will be AI.”
The narrative lag is the gap between what structural indicators show and when the consensus narrative catches up. This gap is itself analytically useful: it tells you how much information advantage remains in reading the structural layer. When the narrative and the structure align, the analytical advantage disappears. Right now, the gap is as wide as I’ve ever measured it.
Here’s a concrete way to think about it. The ADP Research “Today at Work 2026” survey of 39,000 workers across 36 countries found that only 22% of workers globally “strongly agree” their job is safe from elimination. Among front-line individual contributors: 18%. Even among C-suite executives: 35%, barely more than a third. The Mercer Global Talent Trends 2026 survey of 12,000 workers found that 40% fear AI will make their job obsolete, up from 28% in 2024. The Jobs for the Future survey found that optimism about AI’s employment impact dropped 10 percentage points; only 39% now feel positive.
The workers feel it. The consumers feel it, hence the record-low sentiment reading. The financial markets don’t feel it, hence the rally on the jobs report. The policy apparatus doesn’t feel it: the Economy of the Future Commission Act won’t produce recommendations until Q2 2027, and the DOL’s current retraining capacity serves roughly 60,000 workers annually against a tech sector alone displacing 55,000 to 120,000 per year.
The gap between who feels it and who doesn’t is the narrative lag made visible.
Compound fracture
Tariffs and AI are compressing opposite ends of the labor market at the same time. I haven’t heard anyone talk about these in tandem.
Since Trump’s “Liberation Day” tariff announcement in April 2025, the economy has shed an estimated 89,000 manufacturing jobs and 123,700 transportation/warehousing jobs through February 2026. That’s 189,600 blue-collar jobs lost to trade disruption. Simultaneously, AI is taking white-collar knowledge work: finance, tech, legal, professional services.
The perverse interaction: tariffs are supposed to incentivize domestic manufacturing investment. But manufacturers are responding to tariff-driven cost pressure by accelerating AI and automation investments to offset higher input costs. As CNN’s tariff impact tracker noted: “Tariffs are not the sole reason for the sluggish job market; advancements in artificial intelligence have enabled businesses to operate with fewer employees, exacerbating the situation.”
The CNBC Supply Chain Survey from January showed supply chain manager layoffs doubling from 16% to 32% post-tariffs, with 56% of firms worried about recession. At the American Manufacturing Summit in March, 98% of manufacturers reported exploring AI automation, though only 20% were prepared to deploy at scale.
This is the compound fracture. There is no sector of the economy simultaneously gaining from both tariff protection and AI immunity. Construction comes closest, and construction indeed added 26,000 jobs in March. But one sector cannot absorb the displacement from all others.
The healthcare sector, which carried the March print, presents its own version of this tension. Healthcare added 89,900 jobs in March, the largest sectoral gain. But Challenger data shows healthcare/products cuts at a record Q1 of 23,520, the highest first quarter ever. UnitedHealth Group is targeting $1 billion in AI-enhanced cost savings in its insurance division. The sector is simultaneously the largest source of new jobs and quietly restructuring its administrative and insurance back-office functions. The clinical side, nurses, physicians, therapists, faces a shortage. The administrative side faces the same AI displacement pressure as every other knowledge-work sector. These two realities coexist in the same industry, and the BLS aggregates them into a single number.
A single number that tells you everything is fine.
What to watch for May
Seven things I’m tracking for the next installment:
1. The March JOLTS report (due late April). February’s hires rate of 3.1% was an alarm. If March confirms or worsens, the “frozen labor market” thesis, employers posting openings but not converting them to hires, becomes difficult to argue against. An Enhancv survey estimates 27% of all job listings are ghost postings with no intention to hire.
2. Q1 2026 earnings calls. Listen specifically for profit-per-employee language migrating out of tech and into financial services, healthcare administration, and professional services. The metric is spreading. Business Insider has already noted that companies are “no longer competing on headcount, they’re competing on efficiency.”
3. Whether the April BLS confirms or reverses the March bounce. The March print was strong on the surface. If April reverts to the 50,000-80,000 range, it confirms the three-month average of roughly 68,000 as the real trend line.
4. Initial claims. The 4-week moving average of 209,500 remains stubbornly low, well below any alarm threshold. I’ve noted previously that the 75% non-filing rate for unemployment insurance may render this indicator structurally incapable of triggering in a displacement-driven downturn (as opposed to a demand-driven recession). But the stability of claims data is a genuine counterargument to the acceleration thesis, and I want to name it honestly.
5. Entry-level hiring data. The pipeline is collapsing. Resume.org found 36% of companies expect to stop entry-level hiring by year-end. Stanford Digital Economy Lab data shows employment for 22-25-year-old software developers down roughly 20% from the late 2022 peak. Only 30% of 2026 graduates are securing full-time employment, down from 41% in 2024. This is where the pipeline disruption becomes structural.
6. The tariff-AI interaction. If tariff uncertainty persists into summer, manufacturers will continue to lean into automation as a hedge against cost volatility. Watch for announcements that frame AI investment as a response to trade policy.
7. AI agent cost trajectory. The KPMG survey shows organizations projecting an average of $207 million in AI spend over the next 12 months, nearly double last year. As costs fall and capabilities improve, the economic threshold for replacing each successive human task drops with it.
Honest caveats
This analysis is only useful if it’s honest about what could prove it wrong.
The March print was genuinely positive in several sectors. Construction, manufacturing, leisure and hospitality all added jobs that weren’t just statistical noise. The organic 143,000 (ex-strike) is not a weak number in isolation. If April and May print similar numbers, the three-month average climbs back to a range that challenges the deceleration thesis.
Claims data remains remarkably stable. Initial claims at a 4-week average of 209,500 with continuing claims at 1,794,000, the lowest since May 2024, is not what an accelerating displacement story should produce. The 75% non-filing rate hypothesis explains this, but it could also mean displacement is genuinely slower than the other indicators suggest. I take this signal seriously.
AI washing is real. Sam Altman himself acknowledged: “There’s some AI washing where people are blaming AI for layoffs that they would otherwise do.” Cognizant’s Chief AI Officer: “Sometimes AI becomes the scapegoat from a financial perspective.” The NBER CFO Survey found over 80% of firms report no measurable impact on employment or productivity from AI. The signal is real, but it is noisier than the headline numbers suggest.
DOGE federal cuts confound the signal. The 355,000-job decline in federal employment since October 2024 is a policy choice, not an AI effect, even if some agencies are rehiring workers and spending more than before the cuts. Separating federal workforce reduction from AI-driven private-sector displacement is important and difficult.
The productivity data hasn’t moved. BLS Q4 2025 data shows nonfarm business labor productivity at +1.8% annualized. There is no clear “AI signature” in the macro productivity numbers. If AI were genuinely transforming productivity at scale, you would expect this figure to be moving. It isn’t, yet. This could mean the displacement is real but the productivity offset hasn’t materialized, which would be a different and more concerning scenario. Or it could mean both the displacement and the productivity gains are smaller than the micro-level indicators suggest.
The regret-rehire cycle could be larger than I’m modeling. If the Gartner prediction is right, that half of AI-attributed cuts will be reinstated by 2027, the net displacement through this cycle could be substantially lower than the gross announcement numbers suggest. I’m modeling the oscillation as damping toward lower headcount. But the amplitude of the oscillation matters for timing.
Looking toward Q3
In August 2025, the first Hari Projection said that Q1-Q3 2026 would be the window where AI-driven workforce displacement moved from signal to structure. We are now inside that window. The chain is tracking ahead of the base case on five of six links. The sixth, headline unemployment, is lagging, but the indicators underneath it (discouraged workers, long-term unemployment, labor force participation, hires rate) are deteriorating on schedule or ahead of it.
What do the next six months likely look like?
Q2 earnings season (July) will likely show the broadest adoption of AI efficiency language yet. Every company watching Block’s stock rise 24% on a 40% workforce reduction is learning the same lesson. Expect “profit per employee,” “AI-enabled efficiency,” and “workforce optimization” to appear in earnings calls across financial services, professional services, and healthcare administration, not just tech.
The regret-rehire cycle will continue, but dampen. Companies in their second or third oscillation will cut with more precision, better data on which tasks automate well, and less of the “cutting in anticipation” pattern that characterized the first wave. The HBR finding that 60% of cuts were anticipatory will likely shrink as organizations accumulate actual deployment data.
The entry-level hiring collapse will likely spread. It’s already visible in tech and professional services. The KPMG data showing 57% of leaders say AI agents have already changed their approach to entry-level hiring, and a Goldman Sachs analysis estimating AI is erasing roughly 16,000 net U.S. jobs per month, suggest this will migrate into financial services, healthcare administration, and legal support by Q4.
The evaporation dynamic will likely accelerate. AI agent costs continue to fall. Each new price point makes a new category of task economically automatable. The 54% deployment rate that KPMG measured is climbing a steep curve. The service-sector multiplier, estimated at 3-5 service jobs at risk per tech job lost, operates on a 2-4 quarter lag. The tech layoffs of Q1 2026 will begin to manifest in regional service economies by Q3-Q4.
If tariff-driven cost pressure persists, manufacturing will layer AI automation on top of trade restructuring. The 98% of manufacturers exploring AI automation are looking at it partly because tariffs have made labor cost reduction more urgent. This is the double squeeze.
The structural story will become harder to hide behind headline numbers. As seasonal adjustments normalize and one-time factors (strikes, federal cuts) fade from the calculation, the underlying trend, which I estimate at approximately 68,000 jobs per month, will become the visible trend. It’s unclear whether the economy can sustain job creation at that rate while absorbing the multiplier effects from the displacement that has already occurred.
The NBER/Duke CFO Survey from March projects AI-driven job cuts at roughly 502,000 in 2026, a ninefold increase over 2025’s 55,000. Goldman Sachs research from early April estimates AI is erasing approximately 16,000 net U.S. jobs per month (25,000 substitution minus 9,000 augmentation). These are projections, not certainties. But they come from institutional research teams with access to granular firm-level data, and they align directionally with the structural pattern the Hari chain has been tracking since August.
If these projections are even partially correct, the math on headline employment becomes difficult by late 2026. A labor market generating 68,000 jobs per month while absorbing 16,000 net AI-driven losses produces a net of approximately 52,000, below the roughly 100,000-120,000 monthly pace needed to keep up with population growth. I expect this to be the defining issue of the November midterm elections. The headline unemployment rate would begin to rise meaningfully by Q4 2026 or Q1 2027, even without a traditional demand-side recession.
Mind the gap
I want to be precise about what this analysis is and what it isn’t.
It is not a prediction that the economy is about to collapse. GDP grew at reasonable rates through 2025. Wage growth is positive. Claims are stable. These are real data points that describe a real economy that is still functioning.
What this analysis shows is a structural transformation happening underneath numbers that were designed to measure a different kind of economy. The BLS payroll survey, the unemployment rate, initial claims: these instruments were built to detect demand-driven recessions, the kind where businesses lose customers, cut workers, and the cuts show up in claims filings and payroll reports within weeks.
AI-driven displacement doesn’t follow that pattern. It shows up as tasks that don’t get assigned. Roles that don’t get posted. Junior positions that disappear from the hiring plan. Hours that get absorbed by a tool instead of a person. The displaced worker doesn’t file an unemployment claim; they freelance, consult, drive for Uber, start a business application, and exit the labor force statistics at a rate of 396,000 in a single month.
The work doesn’t go away. The containers change. The margin that used to go to a human employee goes to a software subscription and a smaller team. The economy gets more productive in the aggregate, eventually, but the transition period produces exactly the pattern we’re seeing now: strong headline numbers, deteriorating structural indicators, record-low consumer sentiment, and a growing gap between the narrative and the reality underneath it.
Is unemployment rate a useless number? It might be.
Ten weeks to Q3. The chain is tracking. The oscillation is dampening. The evaporation is accelerating. The narrative hasn’t caught up.
This is where the danger lives: not in the number, but in the distance between the number and the thing it’s trying to measure.
And here is the thing about measurement gaps. They close. The structural math, unlike the press releases, doesn’t negotiate. You have two, maybe three quarters to position yourself on the right side of this, to build the skills, the networks, the understanding of where value is migrating. The distance between the number and the thing is your window. Use it before the consensus catches up.
This is the fourth installment in an ongoing series tracking AI employment leading indicators. Part 1: The Last Normal Year (August 2025). Part 2: AI Is Coming for Your Job After All (February 2026). Part 3: Underneath (March 2026). See also: The Evaporation Thesis (March 2026).
This analysis uses the Causal Chain Projection Framework (Hari v3.0) and draws on the March 2026 Employment Situation Report (BLS), JOLTS February 2026, ADP National Employment Report, Challenger Gray & Christmas job cut data, Federal Reserve FEDS Note on AI Adoption, KPMG Q1 2026 AI Pulse Survey, Dallas Fed research on experience premiums, Stanford Digital Economy Lab employment studies, University of Michigan Consumer Sentiment Survey, and current reporting from Fortune, Bloomberg, Forbes, CNBC, Goldman Sachs Research, and Tom’s Hardware.
The May projection will publish after the April BLS release. If you’re tracking similar signals in your sector or building resilience for what’s emerging, I’d love to hear what you’re seeing.
Good analysis, and the subtext is clear. This is a systemic redesigning of the labor economy... primarily resulting in a generationally huge independent worker (freelancer, etc.) sector. More than half of workers by some estimates will be at least partially self-employed. We have not built an economy like this since before the Industrial Revolution. Ad the monopolitic/oligarichal structure of nearly every major industry and risks abound. Leaders need to learn how to lead through contraction and stagnation which as much more to do with business design than it does with AI deployment. More in my brief comments here: https://youtu.be/s2m4rkhrihM
Interesting take. I think the biggest shift isn’t just job loss, it’s how fast expectations are changing… same roles but now you’re expected to do more with AI.