
Underneath
The real story of AI-driven job displacement.

This article is an update to my original projection in August 2025 that anticipated significant AI-driven job displacement beginning in Q1 2026. The consensus at the time tended to be 3-4 years. Last month I revisited the analysis six months later, and there were a few surprises and a lot of confirmation.
I committed then to publishing an updated analysis each month. This month’s signals moved substantially. The purpose of sharing this is to show the system moving beneath the numbers. Unemployment, GDP… those are lagging indicators. I developed the Hari projections to track leading indicators and their vectors, establishing signal in the noise. The point was to be roughly right rather than precisely wrong.
The news is short-term grim. I’m not sharing these projections for shock value, though. My intention is to show the direction of large trends and the nuance within them. I identify thresholds beyond which trends compound. I recommend decision points for companies, investors, and individuals throughout the system. My aim is to provide you a different lens that will help you anticipate and make your best decisions.
There’s a sentence buried on page 7 of the February Employment Situation Report that almost nobody will read. It says: “The number of discouraged workers, a subset of the marginally attached who believed that no jobs were available for them, decreased by 128,000 to 464,000 in February.”
That sounds like good news. Fewer people discouraged. Progress.
Except labor force participation fell in the same report. It dropped from 62.1% to 62.0%. If 128,000 discouraged workers became less discouraged, you’d expect them to start looking for work again. The participation rate should have gone up. It went the other direction.
So where did those 128,000 people go?
They didn’t re-enter the labor force. They reclassified. BLS tracks several buckets of people who aren’t working and aren’t looking: “discouraged” is one. “Other reasons” is another. When a discouraged worker tells the survey they stopped looking because of childcare, or health, or because they’ve given up in a way that doesn’t fit the specific “discouraged” definition, they move from one bucket to another. They vanish from the discouraged count. They don’t appear in the unemployment rate. They just disappear from the numbers that get reported on the news.
That’s the pattern I want to talk about this month. The gap between what the numbers say and what’s actually happening underneath them.
The print
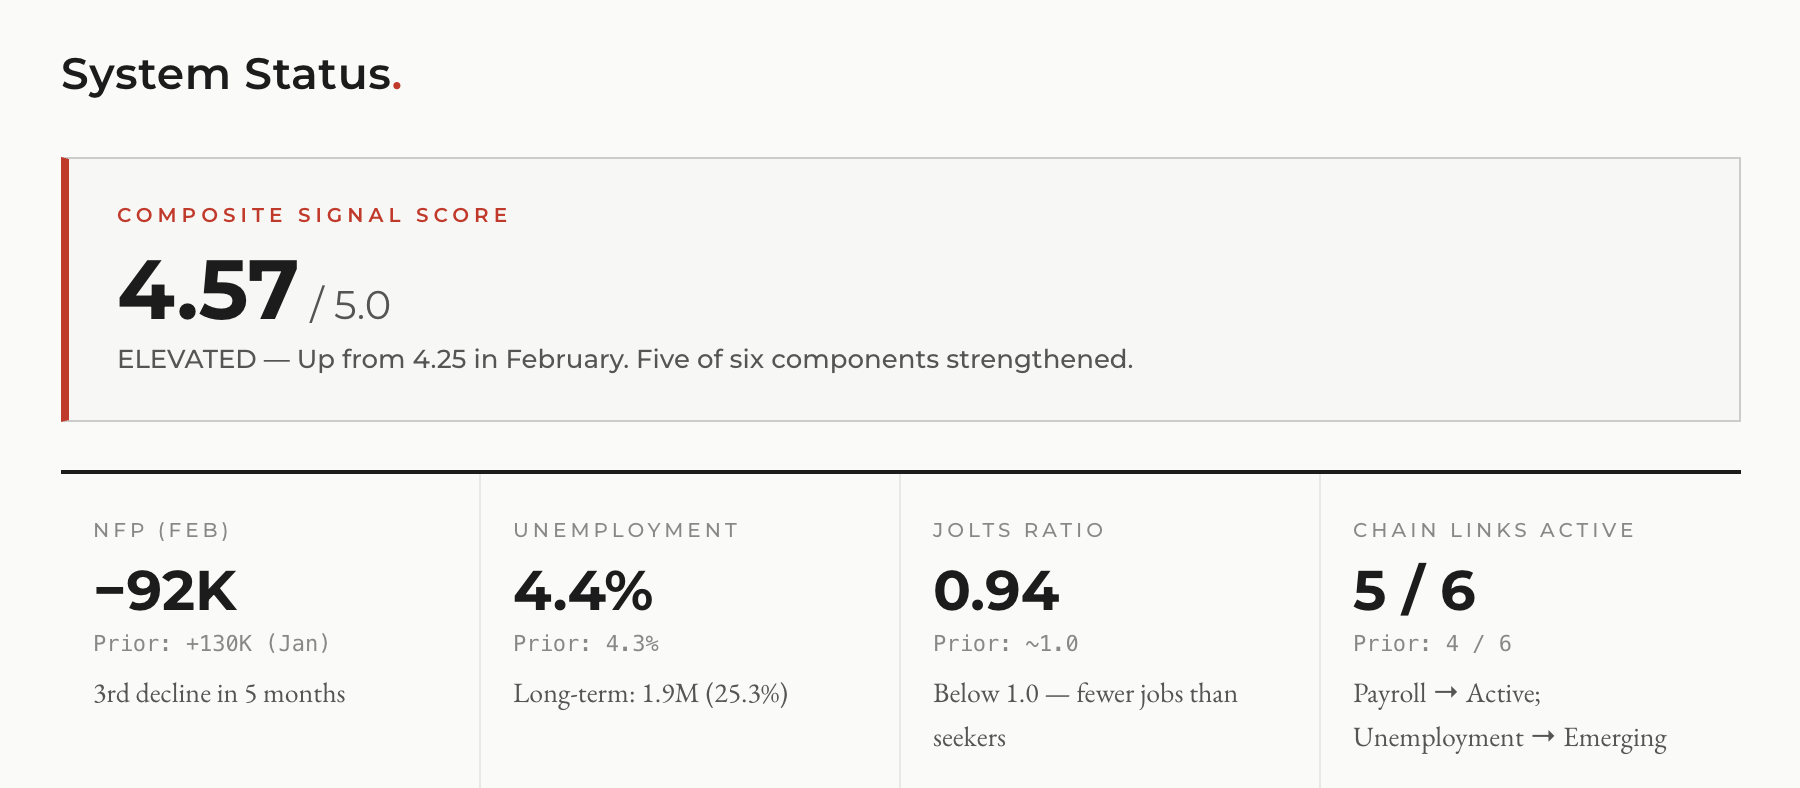
On March 7th, the Bureau of Labor Statistics reported that the economy lost 92,000 jobs in February.
The consensus estimate was a gain of 59,000. The miss was 151,000 jobs wide. December was revised downward again. Combined revisions for December and January subtracted another 69,000 from what we thought we knew.
Unemployment rose to 4.4%. The average duration of unemployment hit 25.7 weeks, the longest in over four years. Long-term unemployment (people out of work for 27 weeks or more) climbed to 1.9 million, now representing one in four unemployed Americans.
There’s a confound worth naming: a Kaiser Permanente strike sidelined roughly 30,000 healthcare workers during the survey week. Strip that out and the print is still negative at -64,000. The information services sector has now lost an average of 5,000 jobs per month for twelve consecutive months. Federal employment fell by 10,000 in a single month.
These are the numbers that made the headline. They are bad. But the more interesting data is in the places almost nobody looks.
The numbers underneath
Start with JOLTS, the Job Openings and Labor Turnover Survey, released March 13th.
Total openings: 6.9 million, down from 7.4 million a year ago. That puts the ratio of open positions to unemployed workers at 0.94. Below 1.0. For the first time since the pandemic recovery, there are fewer available jobs in the American economy than people looking for them.
That number, by itself, would be significant. But pair it with this: the quits rate has been frozen at 2.0% for seven consecutive months. That’s a decade low. Workers are afraid to leave their current positions because they can see what the job market looks like from the inside.
Now add the ADP private payroll number: +63,000 in February, the weakest since mid-2025. And the Challenger data: January 2026 saw 108,435 announced job cuts, the highest January since 2009, up 118% year over year. February added another 48,307. Tech sector cuts alone are running 51% ahead of last year’s pace.
None of these series makes the nightly news by itself. Together, they tell a story the headline unemployment rate doesn’t capture. The labor market is contracting on multiple fronts simultaneously. Openings are falling. Hiring is slowing. Workers are frozen. And the people losing work are, in large numbers, simply not showing up in the official statistics.
Fortune reported this month that nearly 75% of workers displaced by AI-related actions don’t file for unemployment insurance. They have savings. They feel stigma. They think they’ll find something quickly. They don’t. But they also don’t become a number in the system that tracks these things. If that figure is even directionally correct, the real displacement is roughly four times what the claims data suggests.
That’s the gap. The headline rate is 4.4%. The actual situation is significantly worse. And the measurement tools the country relies on were designed for a different kind of recession, one that announces itself with plant closures and mass layoff events and lines at the unemployment office. This one doesn’t do that. This one is quieter.
The profitable companies
Here’s where it gets counterintuitive.
In a normal downturn, companies cut because they’re losing money. Revenue falls, margins compress, headcount follows. The companies doing the cutting are struggling. The logic is survival.
That’s not what’s happening.
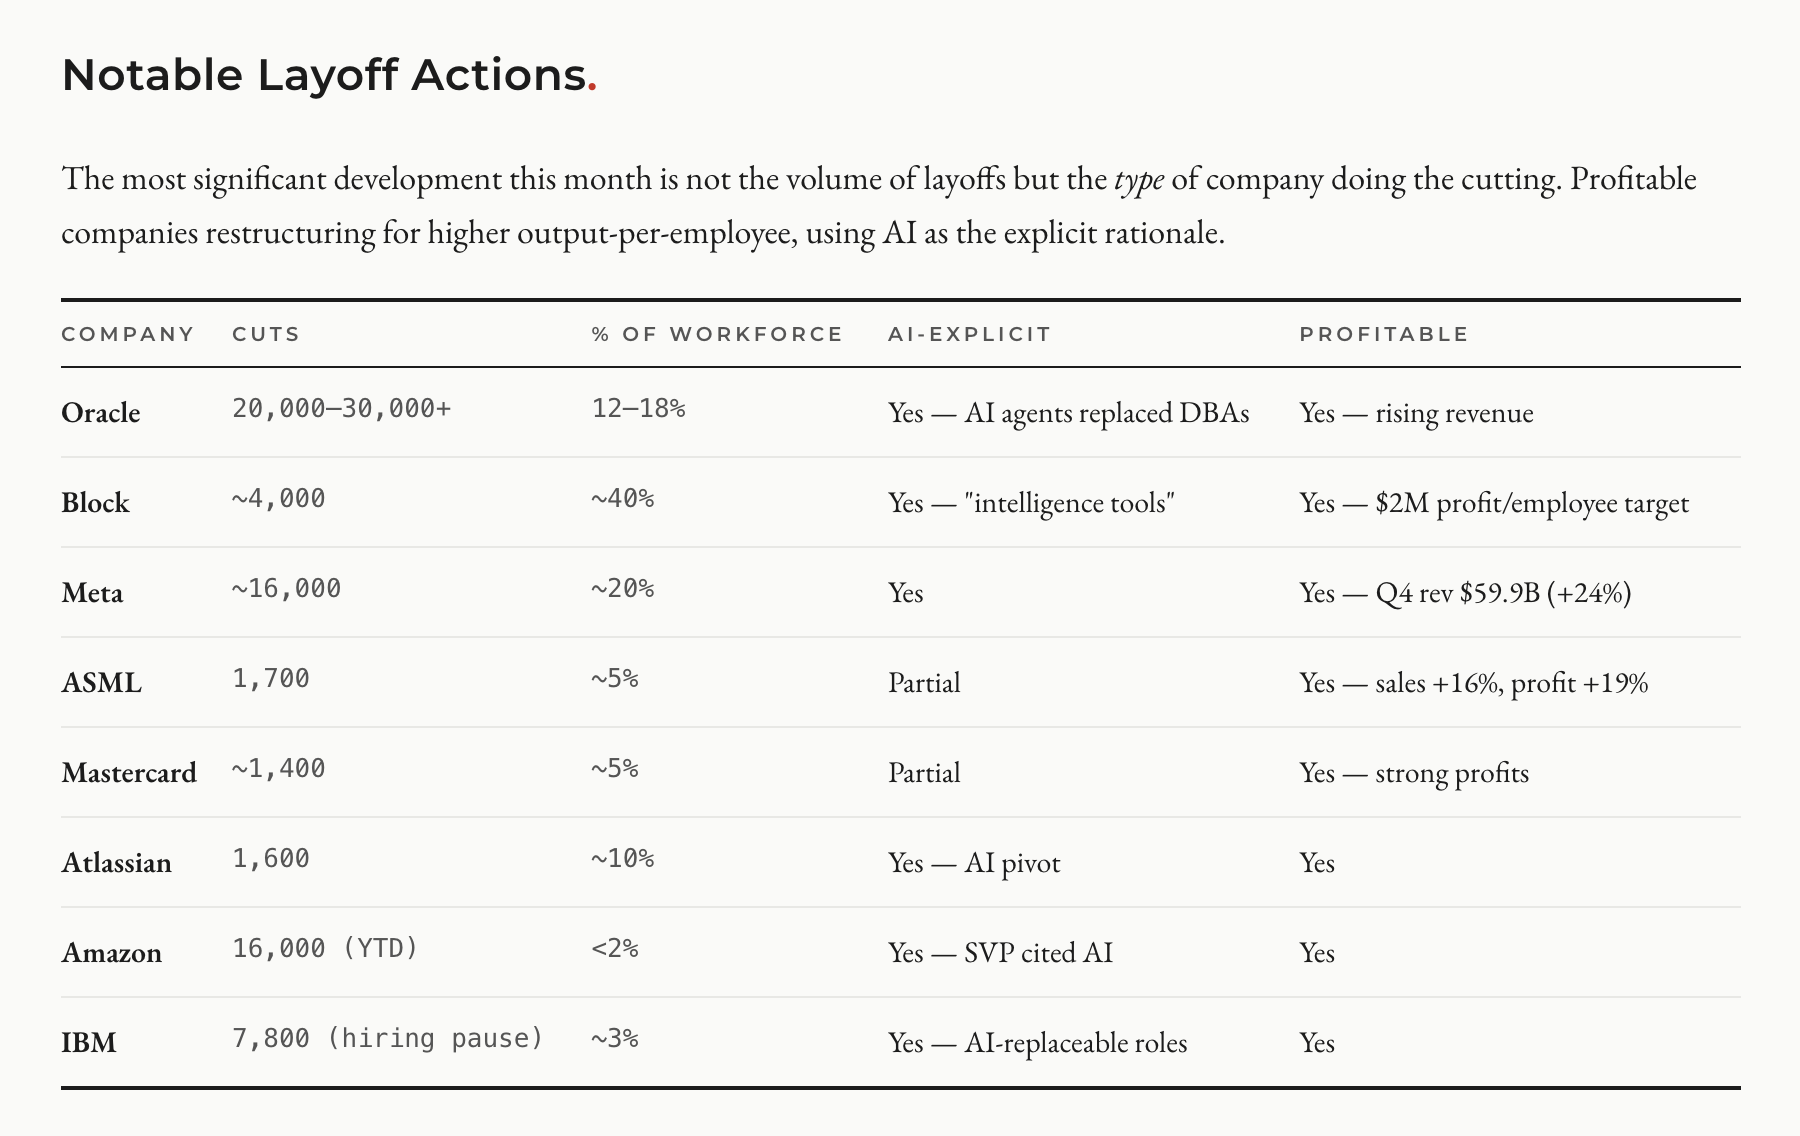
Oracle announced between 20,000 and 30,000 cuts in March. Their revenue is rising. They are spending aggressively on AI infrastructure, carrying over $100 billion in debt to fund the buildout, and restructuring their workforce around AI agents that now handle tasks previously done by database administrators.
ASML, the Dutch semiconductor equipment maker, posted 16% sales growth and 19% profit growth. They cut 1,700 people.
Mastercard reported strong profits. They cut 1,400.
Block, the payments company Jack Dorsey runs, cut 4,000 of its roughly 10,000 employees. Nearly half. Block is on track to generate approximately $2 million in gross profit per remaining employee this year, double the 2025 figure. Dorsey told employees the company is moving toward “smaller, highly talented teams using AI to automate more work.” Then he said something that deserves attention: “I think most companies are late. Within the next year, I believe the majority of companies will reach the same conclusion and make similar structural changes.”
That’s the CEO of a publicly traded company telling you, on the record, that what he just did to half his workforce is coming to most companies within twelve months.
These are not distressed organizations. They are profitable, growing businesses that have decided the optimal number of employees is significantly lower than what they currently have. The gap between revenue growth and headcount is being filled by AI. And the metric that’s emerging as the new benchmark (profit per employee, or revenue per employee) tells you exactly where this goes: up and to the right on productivity, down on people.
The places you wouldn’t expect
The tech layoffs get the coverage. They should. But the data this month surfaced signals in places the typical AI-and-jobs conversation doesn’t reach.
Healthcare companies announced 17,107 cuts in January 2026. That’s nearly six times the January 2025 figure. CVS, Trinity Health, Alameda Health System. The sector people point to as recession-proof and automation-resistant is showing structural stress. Part of it is federal funding changes and reimbursement compression. Part of it is AI-driven administrative automation starting to hit back-office operations. The causes compound.
Dow Inc. led 4,701 cuts in chemical manufacturing, explicitly citing a shift to AI and automation. Chemical manufacturing. Not software. Not consulting. Chemicals.
Entry-level hiring has collapsed in ways the headline data doesn’t capture, and the collapse has a specific shape that’s worth understanding. Entry-level tech job postings fell 67% between 2023 and 2024, and the trend has continued. But here’s the part that matters: job postings labeled “entry-level software engineer” actually increased by 47%. The postings exist. The hiring into those roles dropped 73%. Companies are listing positions they have little intention of filling. The posts serve branding, pipeline building, or compliance purposes. The actual entry-level jobs are disappearing behind a wall of phantom listings.
The numbers on where this goes are stark. 36% of companies surveyed say they will stop hiring entry-level employees entirely by the end of this year. 47% expect to reach that point by 2027.
IBM reported something quietly that stuck with me. Their U.S. voluntary attrition rate fell below 2%, down from a historical norm around 7%. That’s the lowest in 30 years. People aren’t quitting because the outside market feels worse than staying. Everyone is holding still. And when an organization’s voluntary attrition rate falls that far below baseline, it creates a paradox: the company can’t execute a quiet, attrition-based workforce reduction because nobody is leaving. When cuts do come, they hit a workforce that has no recent experience looking for work, entering the weakest job market in years.
The salary split
Compensation data confirms what the Dallas Fed identified last month with their experience-premium research.
Senior software developer base compensation dropped 10% year over year. Senior SQL developers fell 7%. These are experienced generalist roles. People with solid skills and real tenure, watching their market value decline.
Meanwhile, LLM specialists (the people building and fine-tuning AI systems) average $209,000. The overall tech salary increase for 2026 is somewhere between 1.6% and 3.5%, depending on whose survey you read, well below inflation.
The market is repricing technical work in real time. If your skills are specific to building and deploying AI, you are more valuable than you were a year ago. If your skills are general-purpose technical work, even at a senior level, you are less valuable. The gap is widening monthly.
This matches the Dallas Fed’s framework precisely. For occupations with high experience premiums (where judgment, context, and institutional knowledge differentiate experienced workers from entry-level), AI boosts wages. For occupations with low experience premiums (where the work is defined well enough that experience doesn’t matter much), AI compresses wages across the board. The distinguishing variable is tacit knowledge: the things you know how to do that are hard to write down. If your value is in things that can be specified and measured, the specification is what gets automated.
What’s happening to the chain
I’ve been tracking what I call the primary causal chain since last August. It maps six links that connect AI capital investment to measurable employment effects:
Capital Investment → Infrastructure Build → Executive Strategy → Hiring Demand Shift → Payroll Effects → Unemployment.
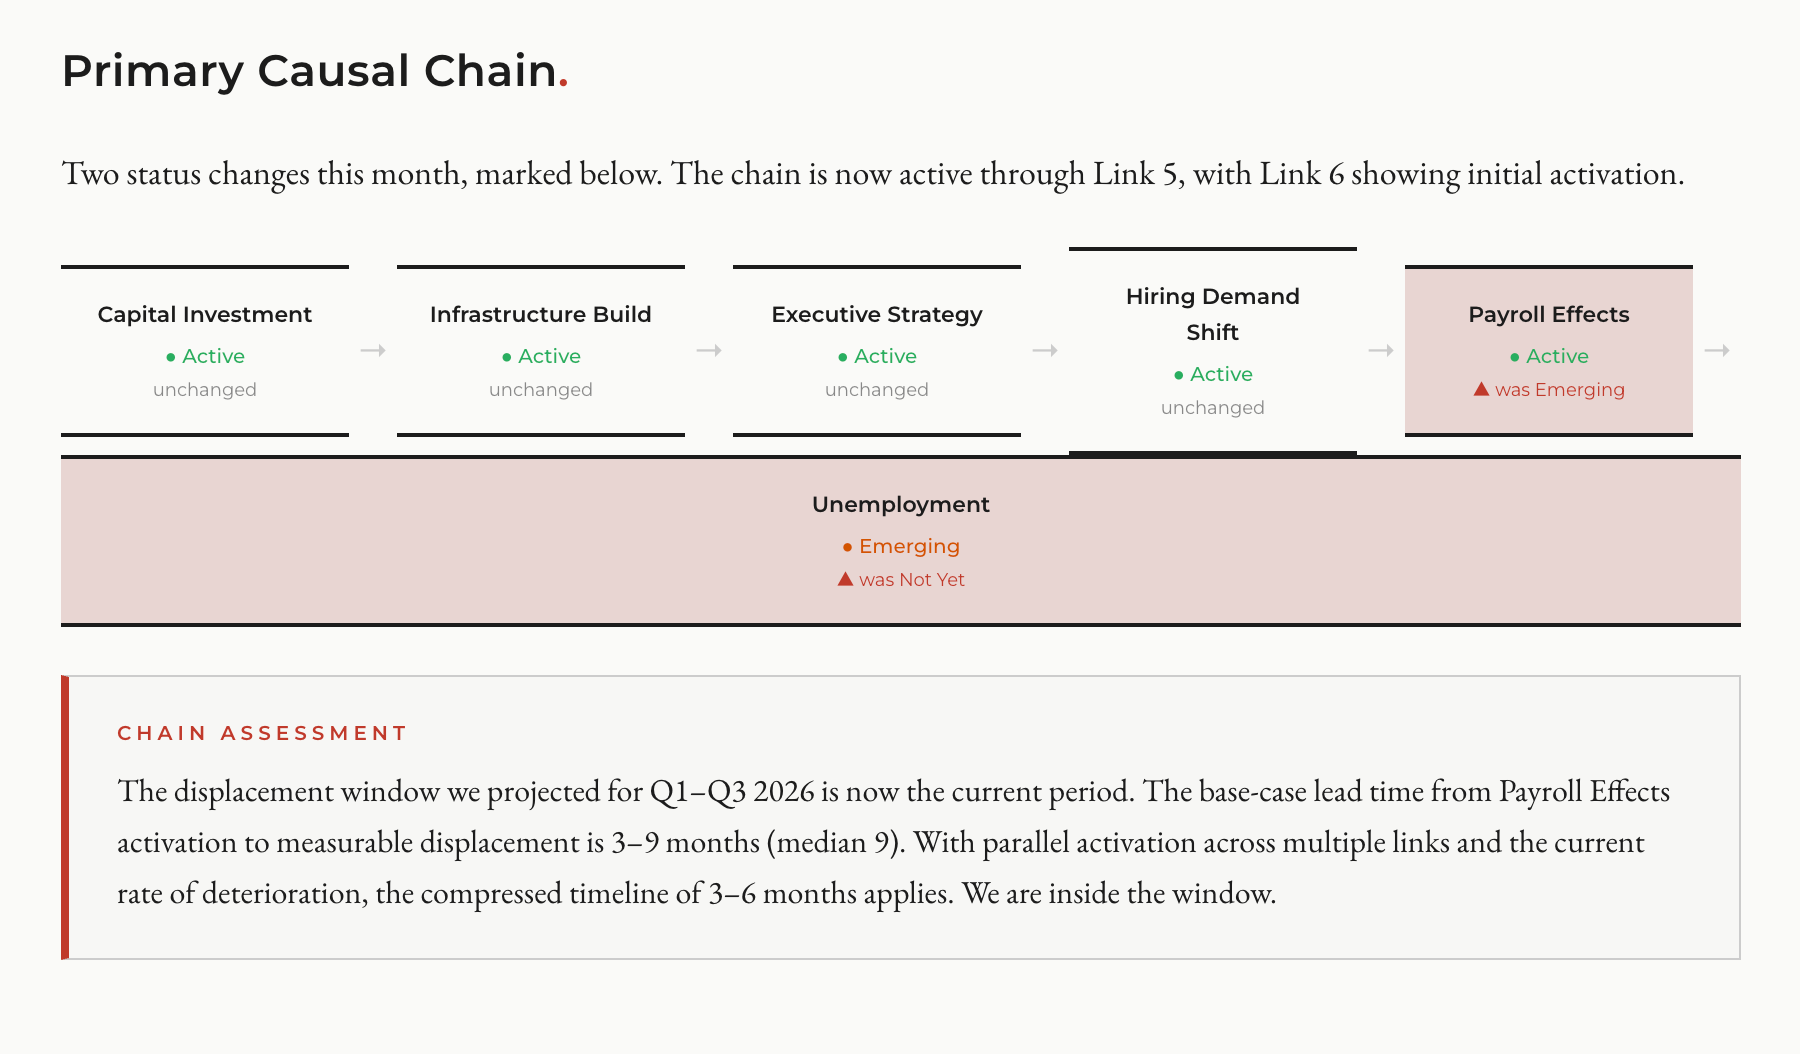
In last month’s update, the first four links were active and the fifth was emerging. This month, two links advanced.
Payroll Effects moved from Emerging to Active. The evidence: a negative NFP print, continued downward revisions, and the ADP confirmation of private payroll weakness.
Unemployment moved from Not Yet to Emerging. The evidence: 4.4% rate, long-term unemployed climbing to 1.9 million, average duration at 25.7 weeks.
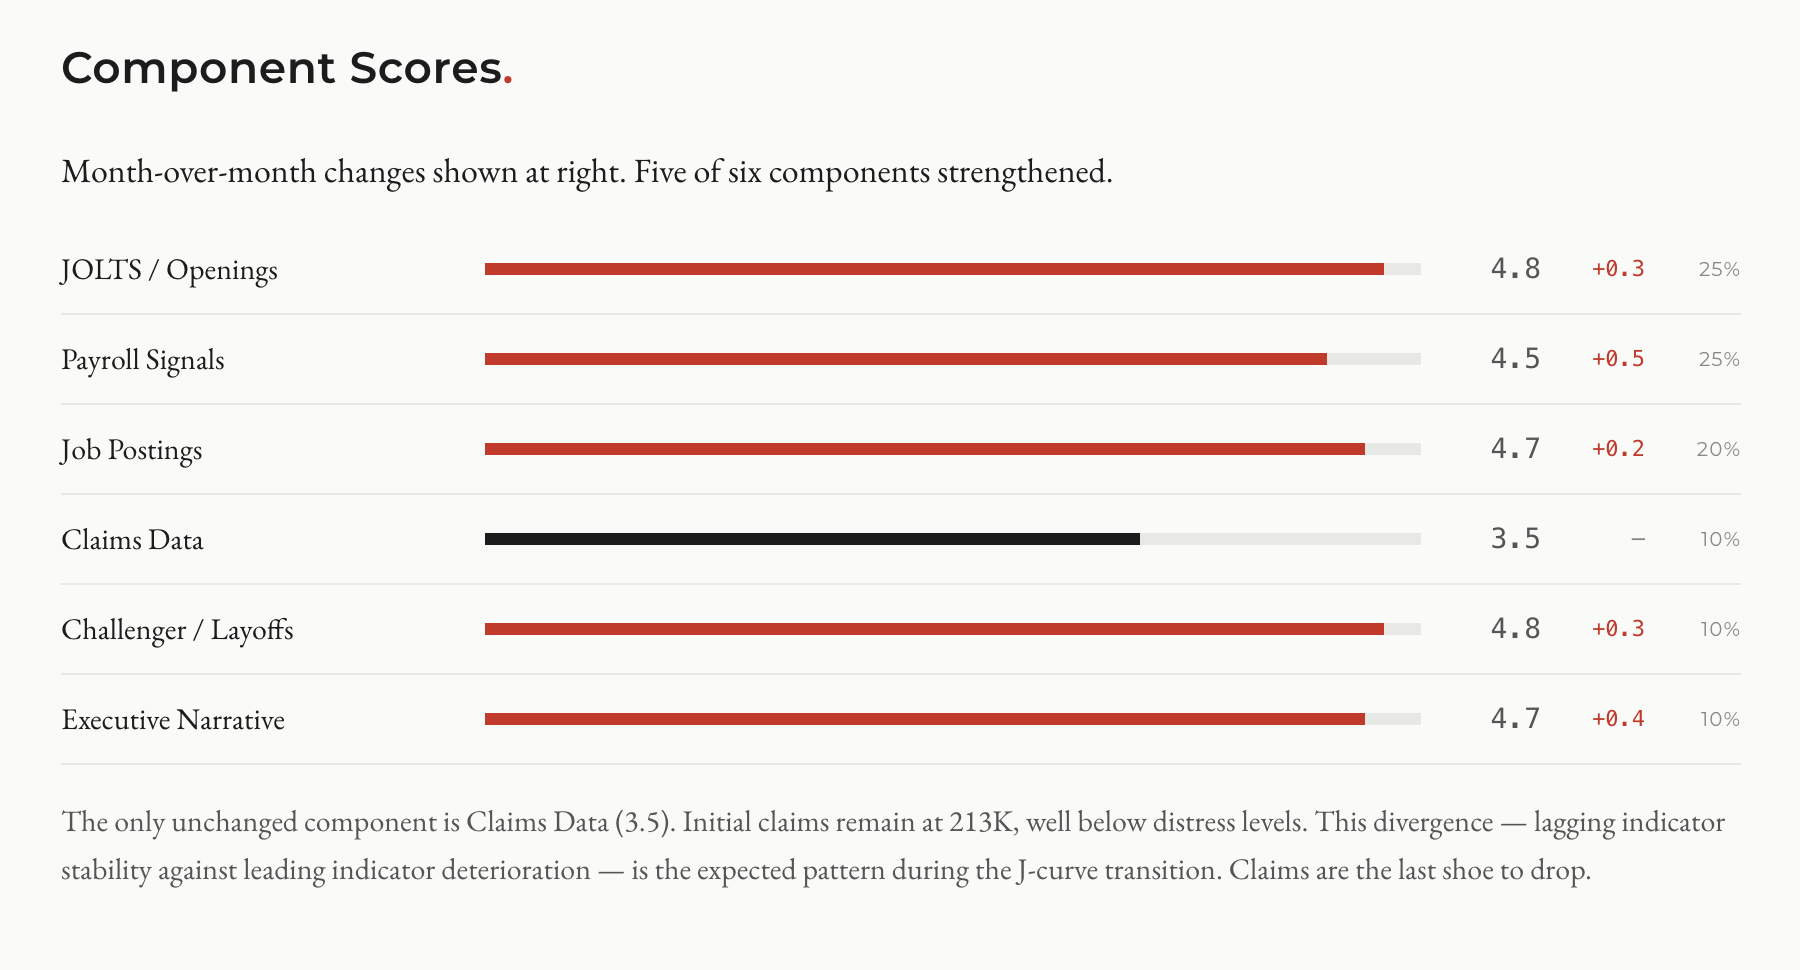
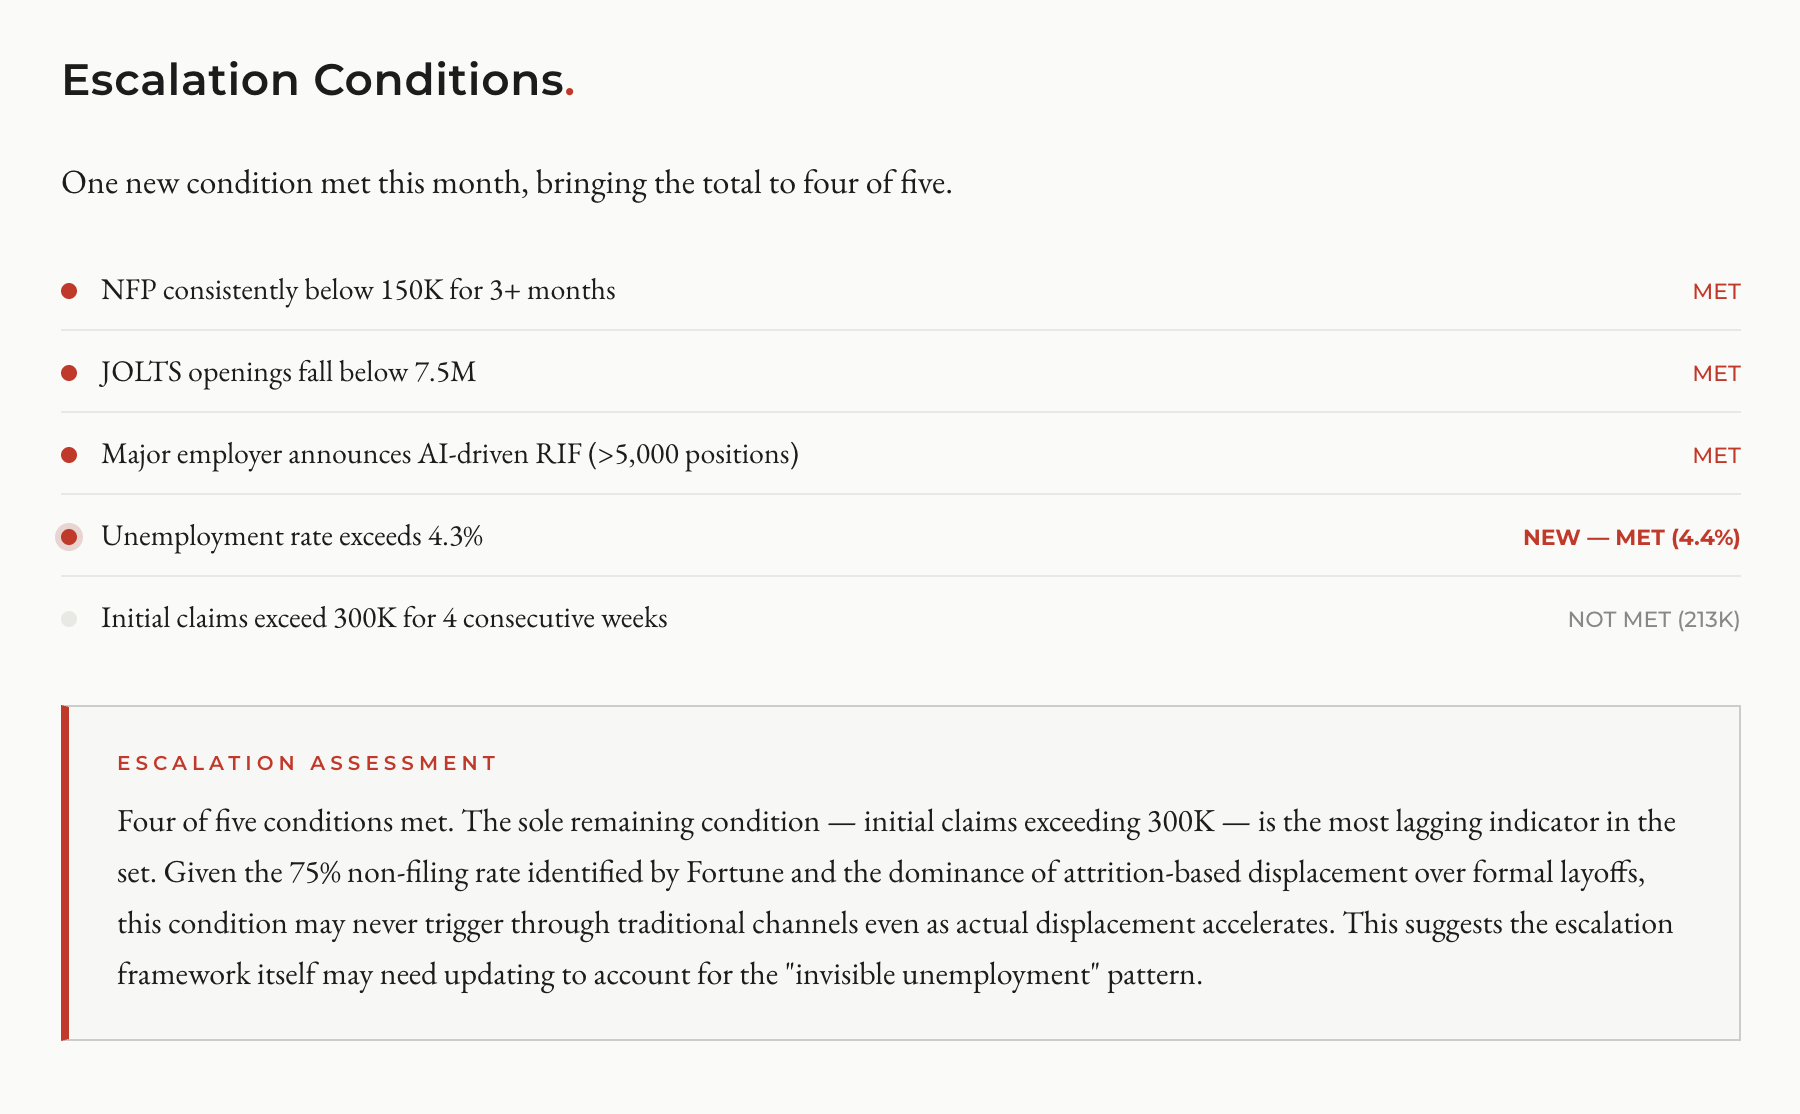
Five of six links are now active or emerging. The composite signal score across the six indicator categories we track (JOLTS, payroll, job postings, claims, layoffs, and executive narrative) moved from 4.25 to 4.57 out of 5.0. Five of six components strengthened. The only unchanged component is claims data, which remains stable at 213,000 initial claims weekly. Claims are the most lagging indicator in the set. They’re the last shoe to drop.
Four of five escalation conditions are met: NFP below 150K for 3+ months, JOLTS below 7.5M, a major employer announcing an AI-driven reduction exceeding 5,000 positions, and now the unemployment rate exceeding 4.3%. The sole remaining condition (initial claims exceeding 300K for four consecutive weeks) may be structurally incapable of triggering in this particular displacement, given the 75% non-filing rate and the dominance of attrition over formal layoffs.
We projected last August that the displacement window would open in Q1 to Q3 of 2026. We are inside that window. The chain is tracking ahead of the base case.
The narrative is catching up
There’s a qualitative shift happening in how institutions and media talk about this.
The IMF chief warned in January of an “AI tsunami coming for young workers.” Goldman Sachs published a forecast expecting unemployment to reach 4.5% by year end. The Dallas Fed released research in February showing AI simultaneously aiding experienced workers and displacing entry-level ones. Anthropic’s own research team published findings suggesting the possibility of a “Great Recession for white-collar workers.” Andrej Karpathy, formerly of OpenAI, published a treemap on March 15th scoring 342 occupations for AI exposure that went viral.
Worker anxiety has tracked the shift. The share of Americans who fear losing their job to AI rose from 28% to 40% in the past year. That’s a 43% increase in a fear metric, which is itself a leading indicator: when enough people believe displacement is real, their behavior changes. They stop spending. They freeze in their current role. They pull back from risk. Fear of job loss produces many of the same economic effects as actual job loss, sometimes faster.
AI adoption keeps climbing. Pew found 21% of U.S. workers using AI on the job by late 2025, up significantly from the prior year. Gallup estimates about 30%. Broader surveys show chatbot usage approaching 37%. The tools are spreading through the workforce while the workforce is contracting. Both of those things can be true at once, and they are.
And the capital keeps flowing in. The four largest hyperscalers (Amazon, Alphabet, Meta, Microsoft) have committed roughly $700 billion in capital expenditure for 2026, with the majority directed at AI infrastructure. Amazon alone is spending over $200 billion. Alphabet plans $175 to $185 billion, more than double their 2025 outlay. These companies are projecting negative free cash flow to make these bets. They are not hedging. They are going all in on a world where AI does more and people do less.
What decisions to make, and when
If you’re running a company, the signal from this month’s data is specific enough to act on.
The window for proactive workforce restructuring through attrition is closing. IBM’s experience shows why: when workers stop leaving voluntarily, you lose the option to reshape your team quietly. The companies that are adjusting now (Block, Oracle, Atlassian) are doing it while they have the choice. The companies that wait will do it under more pressure and less control. Dorsey’s prediction (”within the next year, the majority of companies will reach the same conclusion”) is aggressive, but the direction is right.
The metric to watch is profit per employee (or revenue per employee, depending on your business model). Block’s $2 million target is the clearest public benchmark. If your company is below that trajectory for your sector, you’re either going to get there by restructuring proactively, or the market is going to force you there reactively. Proactive is cheaper. Proactive also means you choose which roles to preserve and which to automate, rather than cutting across the board when margins demand it.
For investors, the sectors most exposed to this employment contraction (consumer discretionary, commercial real estate, staffing firms, mid-market SaaS) haven’t fully priced in the trajectory. The February NFP print was a surprise to consensus. The March print will either confirm the trend or give the market a temporary reprieve. If March comes in negative again, the re-pricing gets aggressive.
For individuals, the salary data tells you exactly where to invest your time. Generalist technical skills are depreciating. The experience premium, the tacit knowledge that AI can’t replicate, is the asset to build. If you’re early in your career and the entry-level pipeline is closing (and the data says it is), you need a different path to building that tacit knowledge. Apprenticeship, freelance project work, contributing to open-source projects, or getting hired at a smaller company where you’ll learn more roles: those are the routes that still exist. The traditional path (apply to a junior role at a large company, get trained, move up) is disappearing.
The decision timing depends on what you’re watching. The next JOLTS report drops March 31. The March Employment Situation lands April 3. ADP reports April 1. Challenger in early April. If those prints confirm the February trajectory (JOLTS below 7M, NFP negative or near zero, Challenger running hot), the structural picture solidifies further. The time to act is before confirmation, because confirmation is when the crowd arrives.
The honest caveats
Three things complicate this picture, and I want to name them.
First, “AI washing.” Some companies are attributing layoffs to AI that are really driven by cost-cutting, margin pressure, or strategic restructuring that would have happened regardless. OpenAI’s Sam Altman has publicly confirmed that this is happening. It muddies the signal. Whether the cuts are caused by AI or merely branded as AI-driven, the jobs are gone either way. But for the purpose of tracking the AI displacement chain specifically, some portion of the attribution is inflated.
Second, DOGE. The federal workforce has shrunk by over 330,000 from its October 2024 peak. That’s a real and significant contraction, but it’s driven by policy decisions, not by the AI displacement mechanism the model tracks. DOGE effects show up in the BLS data and accelerate the headline deterioration, but they’re an external force acting on the system, not a product of the causal chain. Some agencies have started rehiring, which may partially reverse these losses.
Third, the Kaiser Permanente strike distorted February’s healthcare numbers. Roughly 30,000 workers were sidelined during the survey week. That’s temporary. But the 17,107 healthcare layoffs from January are structural and have nothing to do with the strike.
Strip all three confounds out, and the underlying signal is still strongly negative, still directionally consistent with what the model projected seven months ago.
What I’m watching for April
A second consecutive negative NFP would be the clearest signal yet that the “Payroll Effects” link in the chain is fully active. That’s the April 3 report.
Q1 earnings season begins in April. Listen for “efficiency,” “doing more with less,” and headcount guidance. Block’s profit-per-employee language may become the template other CEOs adopt. Earnings call language has been the most reliable leading indicator in this chain from the beginning.
I’m tracking whether the entry-level hiring freeze spreads beyond tech into professional services and healthcare. Whether the JOLTS ratio stays below 1.0. Whether DOGE rehiring accelerates (that would be a counter-signal). Whether Goldman’s year-end 4.5% unemployment forecast holds or gets revised upward.
And I’m watching the discouraged workers number. That quiet sentence on page 7 of the BLS report. The one that looks like good news until you read what’s underneath it.
This analysis uses the Causal Chain Projection Framework (Hari v2.2) and draws on the February 2026 Employment Situation Report (BLS), JOLTS January 2026, ADP National Employment Report, Challenger Gray & Christmas job cut data, Dallas Fed research on AI exposure and experience premiums, and current reporting from Fortune, Bloomberg, CNBC, and CNN Business.
The companion Hari briefing for this month’s data, with full indicator tables and component scores, is available to subscribers.
Thanks for this amazing insight Joseph - yes, very sobering and something to pay close attention to in the coming months.
Thanks Joseph!
Real movement is UNDERNEATH, not in the reported layer. boom!
Most systems measure what already happened. I believe we need to surface what's about to happen.
We’re building around that premise with SHシFT: structured, declared intent as a leading signal before decisions harden into outcomes. Not just for work, but for any domain where direction forms before action. It's exhausting and exhilarating - push on...