Why we care about jobs data
It's about more than who works and who doesn't. Much more.
“A few technologies in history have managed to be both: language, the printing press, and the steam engine are all tools that saved enormous labor and, almost as a side effect, expanded what a person could be. AI belongs to that small category. It makes making things feel more possible.” - Anish Acharya
That quote captures how I feel about this moment. What becomes possible as a side effect of our wrestling with this new technology is what lights me up. On a long enough time scale, I believe most things get worked out and the tech gets where it was going, collapsing clunky old things into invisible new things. But that working out period is where we are today. We’re coming up on the one year mark of tracking effects of AI on the workforce, and what’s taken shape is a trend that goes well beyond the jobs numbers. What’s under those numbers is a much more powerful trend. Knowing where it’s headed makes a lot of things possible.
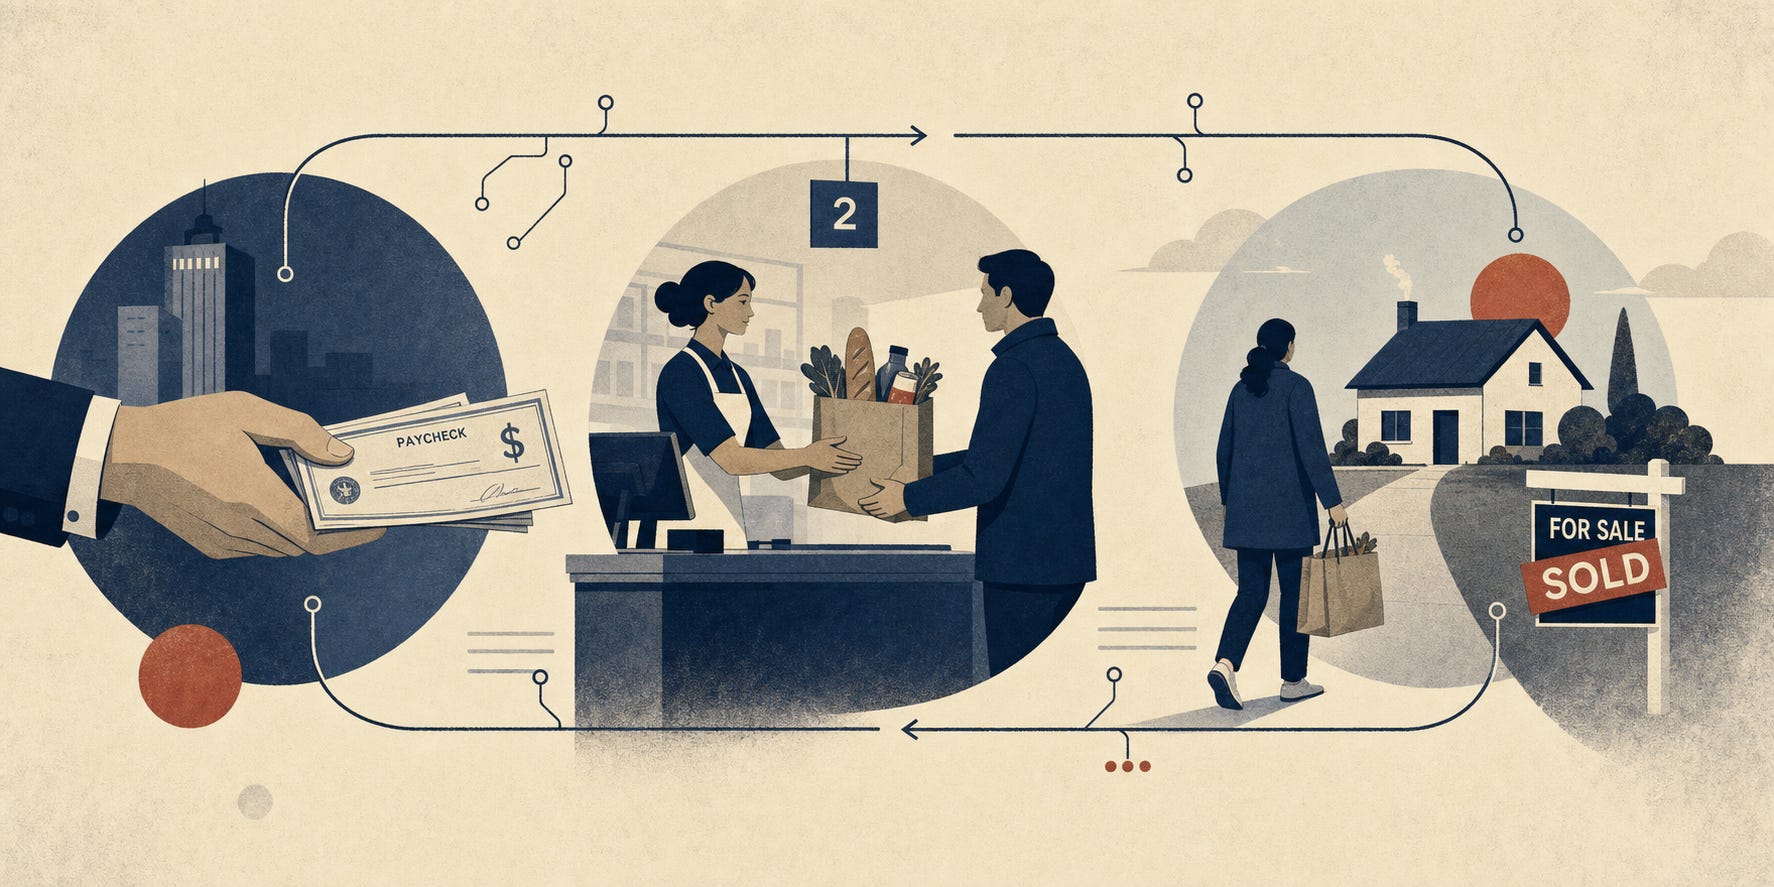
Paychecks buy groceries. Groceries fund supermarkets. Supermarkets employ a manager. The manager pays a mortgage. The bank lends against the mortgage. The whole thing runs on people going to work.
That’s why the jobs report matters. No single number is interesting. The numbers, taken together, are the pulse of the machine that pays for everything.
Every first Friday of the month, the Bureau of Labor Statistics (BLS) publishes what looks like a receipt from the checkout counter of the American economy. Payrolls up or down. Unemployment up or down. Wages up or down. On the surface, a few decimal places. Underneath, whether the circuit is closed.
We read it because we want to know if the machine’s working. This month, the machine looks fine on the front page. All the real stuff is on the back.
An economy is a closed circuit… if it’s healthy
A market economy is a loop. Businesses succeed when customers can afford to buy from them. Customers can afford to buy from them when they have income. Income, for most people, comes from a job. Take out any of the three and the loop breaks. Take out none and everyone wins.
The loop has three failure modes.
First is a shortage of workers. Businesses want to hire, no one’s available, growth stalls. Not great, but a champagne problem compared to the other two.
Second is a shortage of jobs. People want to work, no one’s hiring, income disappears, businesses lose customers, more layoffs, more lost customers.
The third is quieter. Both parties transact, but the terms hollow out. Wages run below inflation. Hours get cut. The best jobs leave and worse ones take their place. The circuit still hums. The amplitude falls.
We are in the third mode. The top line looks steady. The composition is changing.
The June print, in one page
Nonfarm payrolls came in at 57,000 for June, roughly half of what forecasters expected. The unemployment rate fell to 4.2 percent. Under most conditions that would be good news.
The conditions look a little different here.
The labor force shrank by 720,000 people in a single month. Labor force participation fell to 61.5 percent, the lowest reading in fifty years outside the pandemic shutdown. Participation among prime-age workers, ages twenty-five to fifty-four, fell from 83.9 percent to 83.3 percent. The unemployment rate didn’t fall because more people got hired. The word “rate” is where the action is. A rate is a relationship between two things, in this case people who participate in workforce and people who are looking for work. Last month nearly three-quarters of a million people stopped looking.
For the last couple of months, I resisted saying that I don’t trust the numbers. The last couple of months of job reports looked really strong, and that’s worth celebrating. But I wasn’t sure those numbers were right, and BLS agreed. April payrolls were revised down 31,000. May payrolls were revised down 43,000. 74,000 jobs that were on the books a month ago are no longer on the books.
Leisure and hospitality shed 61,000 positions, undoing the previous month’s gain in a single stroke. Healthcare and social assistance added 47,000. Professional and business services added 36,000, the first meaningful positive month in that white-collar band in some time. Information continued its slow decline.
Wages grew 3.5 percent over the year, good but still trailing inflation.
The employment-to-population ratio, the share of the working-age population that actually has a job, came in at 59.0 percent for June (BLS TED). It’s fallen from around 60.1 percent when I published The Last Normal Year last August.
When fewer than 60% of working-age people are working, there’s a story there.
One number measures the ecosystem
The unemployment rate answers a small question. Of the people looking for work, what share can’t find any?
The employment rate answers a bigger one. Of the whole working-age population, what share is working?
The two numbers can move in opposite directions as they did in June. That’s not a paradox. It’s how the accounting works.
When someone loses a job and looks for a new one, they’re counted as unemployed. When they give up looking, they leave the labor force. They’re no longer counted as unemployed. They’re not counted at all. The numerator shrinks. The denominator shrinks. The ratio can stay flat while the pie shrinks. But you still get less pie.
The employment rate has no such door. Every working-age person is in the denominator, whether they’re looking or not, whether they’re collecting benefits or not, whether the political conditions favor their category or not. If they’re not working, they are counted as not working.
June’s 59.0 percent employment rate is roughly 1.2 points below where it stood last August. On a working-age population of 275 million, each tenth of a point is 275,000 people. About three million fewer people are employed today than would be if the ratio had held its August level.
Some of that’s retirement on schedule. Most of it isn’t.
If you want one number that tells you whether the ecosystem is healthy, it’s not 4.2 percent. It’s 59.0 percent.
What could be causing the exit
720,000 people left the labor force in one month. Three explanations compete to explain why.
The first is immigration policy. Work authorization ended June 30 for a cohort of long-tenured green-card holders and non-citizens. Some of these workers had been in their jobs for a decade. Some longer. When authorization ends, they exit the counted labor force whether or not they want to. This is the mainstream explanation right now, and it accounts for a real share of the drop.
The second is demographic gravity. Participation among workers fifty-five and older fell to 37.1 percent in June, a 21-year low. Baby boomers are retiring on schedule. Indeed Hiring Lab economist Laura Ullrich argues we are watching a supply story, not a discouragement story. Not enough workers to fill open jobs. Her group projects the labor force declines by 3.7 percent, or 5.9 million workers, between 2025 and 2032.
The third is displacement dressed up as exit. Someone loses a job to restructuring. Takes severance. Looks for work briefly. Cannot find anything at their old wage. Gives up. Not counted as unemployed. Not counted as displaced. Just gone.
All three are real. The first accounts for a slice, the second for another slice, the third for a slice we can’t yet size directly. The framework we’ve been building in this series lives inside the third channel. It doesn’t require the first two to be wrong.
One data point in this month’s print does a lot of work. Prime-age participation fell from 83.9 to 83.3 percent. The immigration explanation is weaker for this group, most of whom are citizens. The demographic explanation doesn’t touch it at all. Prime-age participation is where the third channel should show up first, and it’s falling.
What would falsify that explanation: prime-age participation stabilizes, quits reaccelerate, the employment rate stops slipping, and professional and business services keeps adding jobs for two or three more months. Prime-age participation is falling. Quits are stalled at 3.1 million. The employment rate dropped 0.2 points in a month. That leaves one test, professional and business services, still open.
Sam and Dario stop sounding the alarm
Six weeks ago, I noted that the frontier AI labs had gone quieter about labor displacement. That looks different now.
Sam Altman told The Atlantic in May that he no longer believes fixed cash payments alone can absorb what is coming. He said he is “much more interested in ways where we think about kind of collective ownership”. This is the same Sam Altman who spent a decade championing universal basic income and funded the largest randomized UBI study in American history. He’s now stepped off that position in public.
Days after Altman’s Atlantic piece, Senator Bernie Sanders proposed that AI companies transfer fifty percent of their equity to a federal sovereign wealth fund. Days after that, Donald Trump said he and Sanders “aren’t that far apart” on the economics and floated giving “pieces” of AI companies to the American public. California governor Gavin Newsom had already signed a May executive order directing the state to study universal basic capital.
Sanders. Trump. Newsom. Bannon. Altman. That’s not a coalition anyone would have drawn up two years ago. It’s the coalition now.
The tell is not what the CEOs say on stage. Nvidia’s Jensen Huang keeps arguing that AI will boost employment (it probably will, but timing is everything). Mark Zuckerberg told employees Meta’s AI push “hasn’t really accelerated in the way we expected” and then laid off 8,000 people, 10% of the company. Microsoft cut another 4,800 on July 6, the third major round in a year. Tech layoffs cited AI as a primary reason for roughly 102,000 cuts in the first half of 2026 alone, more than the whole of 2025.
Meanwhile, OpenAI and Anthropic both filed confidential S-1 registration statements in June. Altman is holding out for a trillion-dollar valuation on OpenAI and appears willing to push the listing into 2027 to get it.
The public message is that AI will create more jobs than it destroys. The private message, encoded in the policy proposals the same executives are now floating in Washington, is that the labor share of the economy is going to compress and someone had better figure out how to redistribute the equity before the compression finishes.
Both can be true. Only one requires you to believe the labor market is fine.
What the framework says
Five of the six chain links from the August 2025 projection are tracking on or ahead of the base case. The sixth, headline unemployment and participation, has moved in the framework’s direction, through the participation channel rather than the official unemployment rate. That’s the mechanism the April piece featured. Legacy indicators, built for a labor market where nearly everyone who wanted work was actively looking, disguise a labor market where a growing share of the displaced simply stop showing up.
Continuing jobless claims have been above 1.8 million for three straight weeks. Not alarming yet. Ticking up.
Our current probability map:
55%: the framework is broadly right, and the lag is longer than modeled. The headline catches up in Q4 2026 or Q1 2027 when severance buffers from H1 2026 announcements expire and continuing claims turn.
20%: augmentation absorbs displacement. Huang’s thesis wins. Meta’s admission this month makes this branch harder to defend, but not impossible.
20%: displacement is faster and more hidden than the data shows. The other shoe drops in Q1 or Q2 2027 with two to three million cumulative displaced workers who never registered as unemployed.
5%: an unrelated shock hits first and changes the frame.
The falsifiable prediction, unchanged: Q4 2026 / Q1 2027 is when severance buffers expire and continuing claims turn. If they don’t turn, the framework has to be revised.
What healthy would look like
A healthy adjustment has four features.
Displaced workers find new roles inside a reasonable window and don’t end up as “not in labor force.”
Wage growth outpaces inflation, so the money reaches the customers who fund the businesses that hire the workers.
Measurement instruments update to reflect a labor market where non-W2 work, non-UI work, and non-searching work are all growing shares of income and non-income.
The political conversation about how to hold the ecosystem together happens on the front end, while the ecosystem is intact, and not on the back end, after the damage is done.
The universal basic capital conversation, whatever its final form, is the front end. That’s a good sign. The fact that it took displacement showing up in the data to get the conversation started is a less good sign.
What we can do, as readers of the print rather than authors of the policy: watch the employment rate, not the unemployment rate. Watch prime-age participation, not headline participation. Watch what the AI CEOs propose in closed meetings with senators, not what they say on stage. And watch the sectors, not just the top line. Healthcare and social assistance are carrying the payroll number right now. Leisure and hospitality lost 61,000 jobs in a month. Professional and business services added 36,000. Any of those could flip in July and change the picture.
Mind the gap
The gap is between the dashboard and the structure. The dashboard says 4.2 percent unemployment. The structure says 59.0 percent employment, falling, with the lowest labor force participation in 50 years outside a pandemic. Both are the same data. One flatters and one warns.
Every economy has moments when the instruments and the reality are pointing in different directions. This is one of those moments. The instruments are not broken. They were built for a labor market that behaved differently from the one we have now. When people stop looking, they stop counting. When they stop counting, the numbers get quieter. When the numbers get quieter, the story gets harder to tell.
But the story isn’t hidden. It’s in the participation rate. It’s in the employment rate. It’s in the sudden bipartisan interest in transferring equity from AI companies to the public. It’s in the layoffs that lead the announcements and the retraining programs that follow. It’s in the difference between what the CEOs say in a keynote and what they propose in a memo.
The number that will matter most in Q4 will not be on the front page.
Watch the 59.0. Watch the 83.3. Watch what stays quiet.
Mind the gap.


